
Azure DevOps Auditing
Overview
My team has had been getting countless questions for SOC2, HiTrust, and SOX audits asking for data from various systems that need to be combined and reported on with short deadlines, especially regarding how our Azure DevOps Services instance is configured.
I found myself wanting to answer simple questions like, “Who has been added/removed from our Azure DevOps Services instance and who made these changes?”. In this quick post, I will show you how Azure DevOps Audit streams can help solve these questions.
Azure DevOps allows you to push data to Log Analytics (Azure Monitor Log) in order to report on the data and combine the data with other logs aggregaged from other sources. Streaming Azure DevOps data to Log Analytics is easy to setup, extremely insightful once implemented, has no maintenance, and is cheap to run (basicially free).
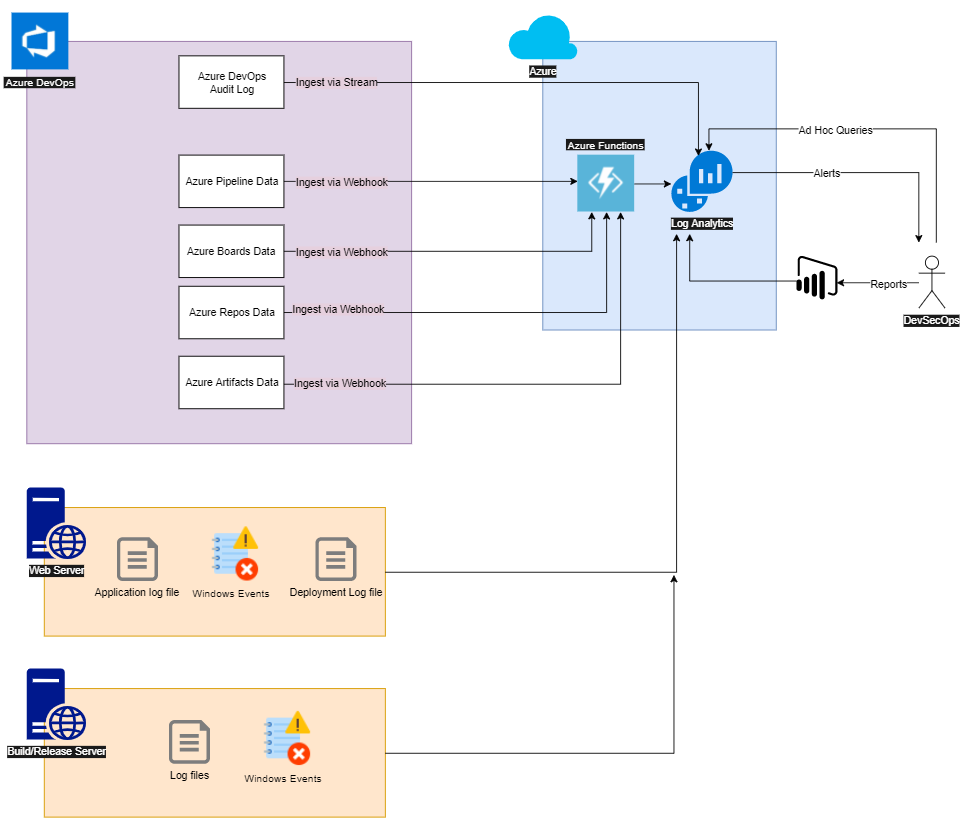
Above is a diagram showing the overall architecture that I have built. The heart of the monitoring system is Azure Monitor Logs (Log Analytics) on the upper right hand side of the diagram. Log Analytics is fed by all of the lines from sources that are aggregating logs and events into it. This becomes a DevOps Datawarehouse that allows employees of the company (e.g., the DevSecOps engineer in the diagram) to query basic events and create more sophisticated queries to gain instant insights into the state of the enterprise. Additionally the engineers can build reports in PowerBI and alerts to gain the next level of control.
For this post, I will be mainly focused on the “Azure DevOps Audit Logs” that is ingested through the Azure DevOps stream mechanism to Log Analytics. In future posts, I will discuss the webhook techniques.
Basics - Step by step instructions
-
Follow the steps to Create a stream.
-
Follow the steps to Set up an Azure Monitor Log stream
-
Once you’ve completed these instructions, you will see a new log called
AzureDevOpsAuditingin theLogManagementsolution of Log Analytics. See the AzureDevOpsAuditing table’s column reference for a detailed breakdown of the column definitions. It may take a couple of minutes to seeAzureDevOpsAuditingas it won’t appear until events occur in Azure DevOps.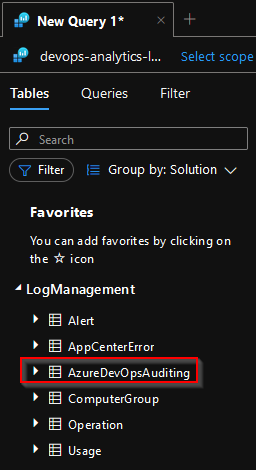
- Click the eye icon that appears next to the
AzureDevOpsAuditingand it will generate a query that will show you the raw data.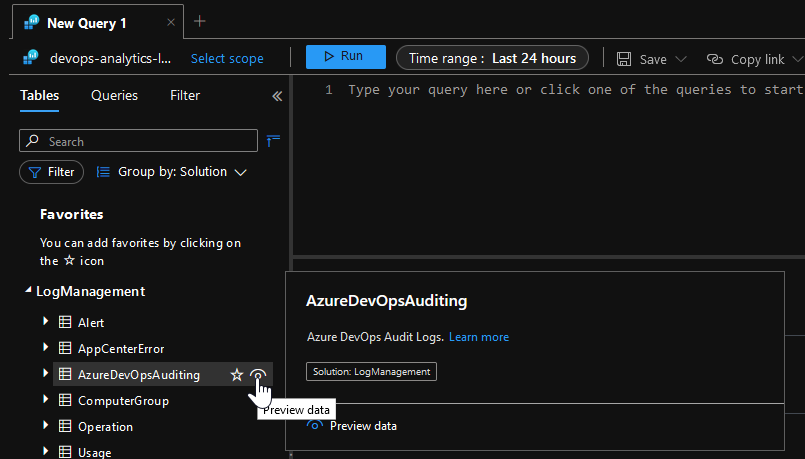
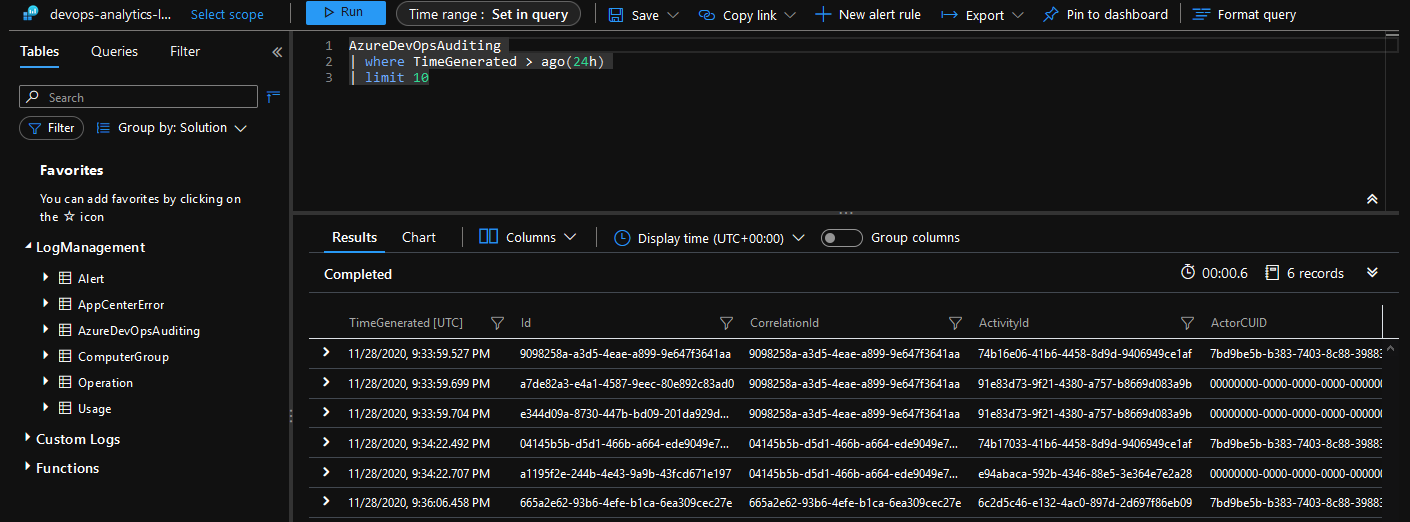
- The raw data will look something like this.
Query for Azure DevOps permission changes
Let’s look at how to query Azure DevOps permission changes. One of the events that I watch is licensing changes to the Azure DevOps Services instance. This is useful for audits and ensures that if any bad actors were to successfully promote their permissions to our Azure DevOps system, we would see it immediately. Note, we have plenty of controls in place to ensure that this never happens, but it’s a good practice to have a “belt and suspenders” security strategy, by having a secondary system keeping an immutable record of events.
-
As an example, I have changed a user, “Release Manager” in my sandbox Azure DevOps project from having
Basicaccess toStakeholderaccess.
-
Query for permission changes
    AzureDevOpsAuditing
    | where Area in ('Licensing')
    //| where ActorDisplayName == 'Michael Erpenbeck'
    | project TimeGenerated, ActorDisplayName, OperationName, Details
    | limit 100

-
Notice that if I had multiple values in the log, I could filter by the
ActorDisplayNameto show only the ones that I changed, by uncommenting| where ActorDisplayName == 'Michael Erpenbeck'. -
If we comment out the
projectline to look at the raw data, we can see that there’s even a dynamic field namedDatathat will tell us the AccessLevel and PreviousAccessLevel. You can imagine that we can create much more sophisticated queries and alerts based on this information.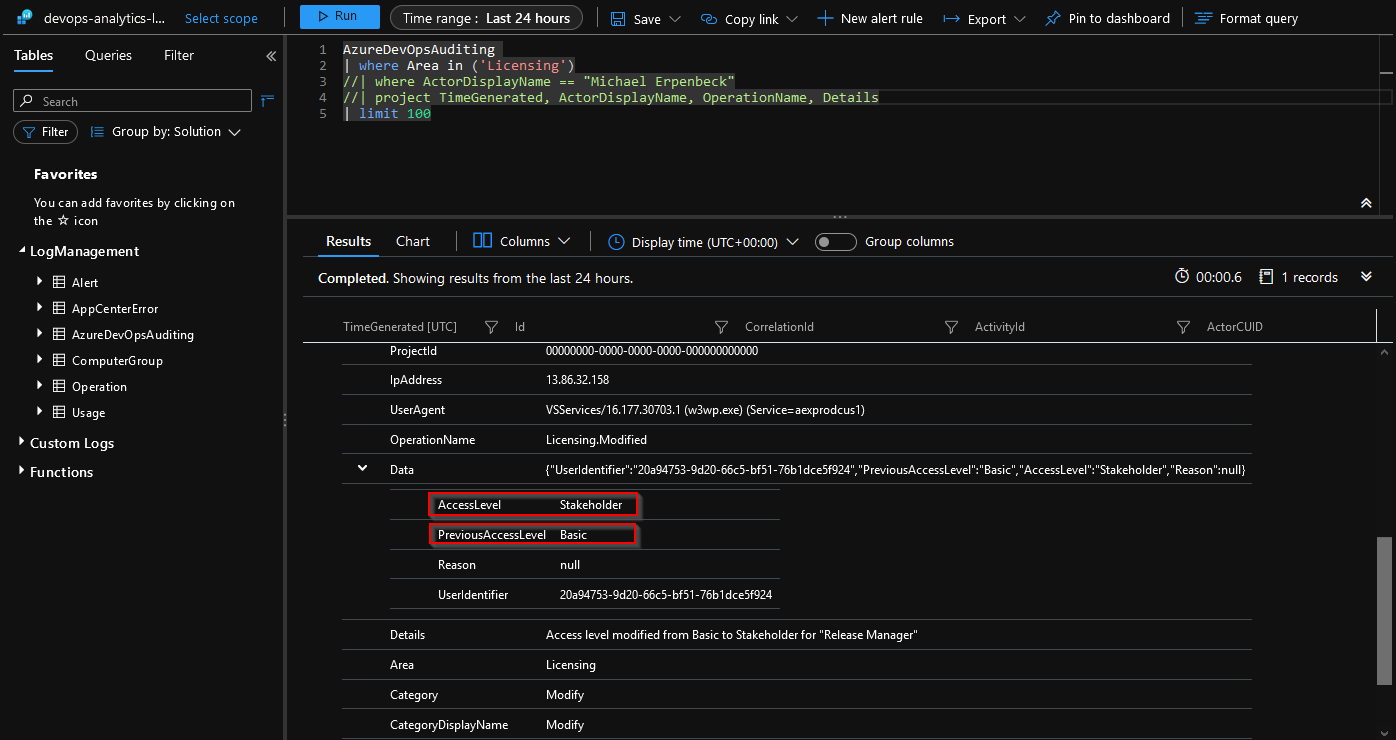
So what else is possible, you ask?
If we do a query to see all of the Areas we can see the following result. Note that my sandbox is only a few minutes old and only has a few areas from the audit logs.
    AzureDevOpsAuditing
    | distinct Area
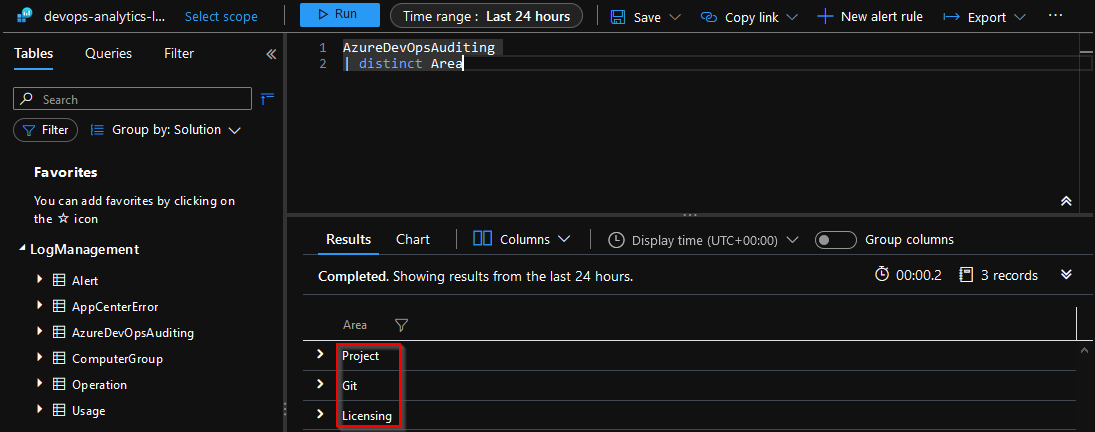
Here is the full list of possible Areas. An especially useful area is the Pipelines and Release areas. In a future blog post, I will document my current use of these areas.
Let me know what you think of this article on twitter @Erpenbeck!